Bad data or bad settings can throw off the Performance Management Chart. The PMC relies on TSS data, and the number of days used to calculate the CTL and ATL can both make the chart show inaccurate data.
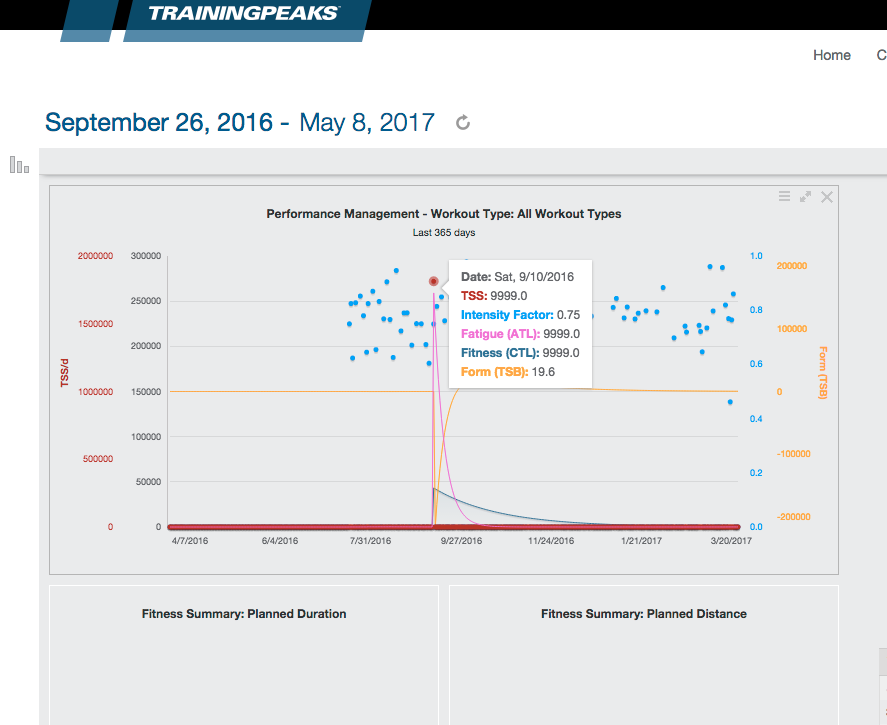
If your PMC shows something like this, it is a good indicator that there is bad data somewhere. A few keys to look for are very high CTL and TSB scores as well as the majority of activities (indicated by the red dots) along the X axis. To fix this, we first need to find the bad data point.
Click the menu button (☰, top right) and select a bigger date range. A good place to start is to choose 'Last 365 Days' under the "Select Date Range" drop-down menu. You should see something like this:

You'll notice if you hover over the red dot that it says "TSS: 9999.0" This is the cause of the problem, and once it is corrected, the PMC should return to normal.
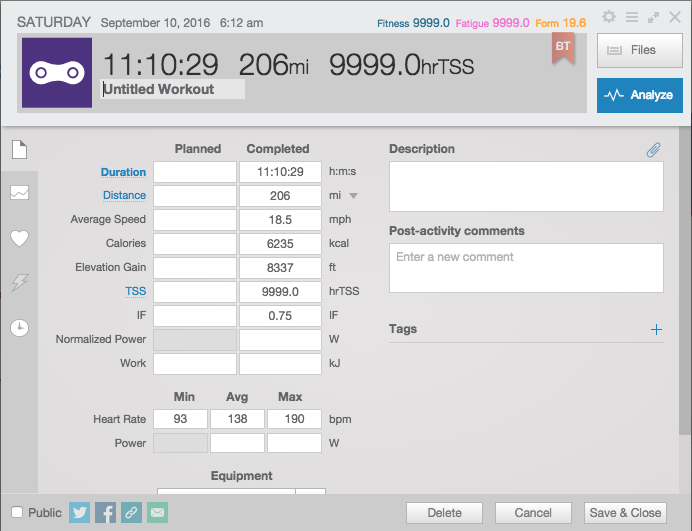
Click the red dot; this will allow you to access the workout with the bad data.

Here you simply need to enter a more realistic TSS (or even a '0') in the completed field. Click 'Save & Close' and you'll see the PMC correct itself.
Please note: if there are multiple bad data points you may need to do this a few times in order to get the PMC to display accurate data.
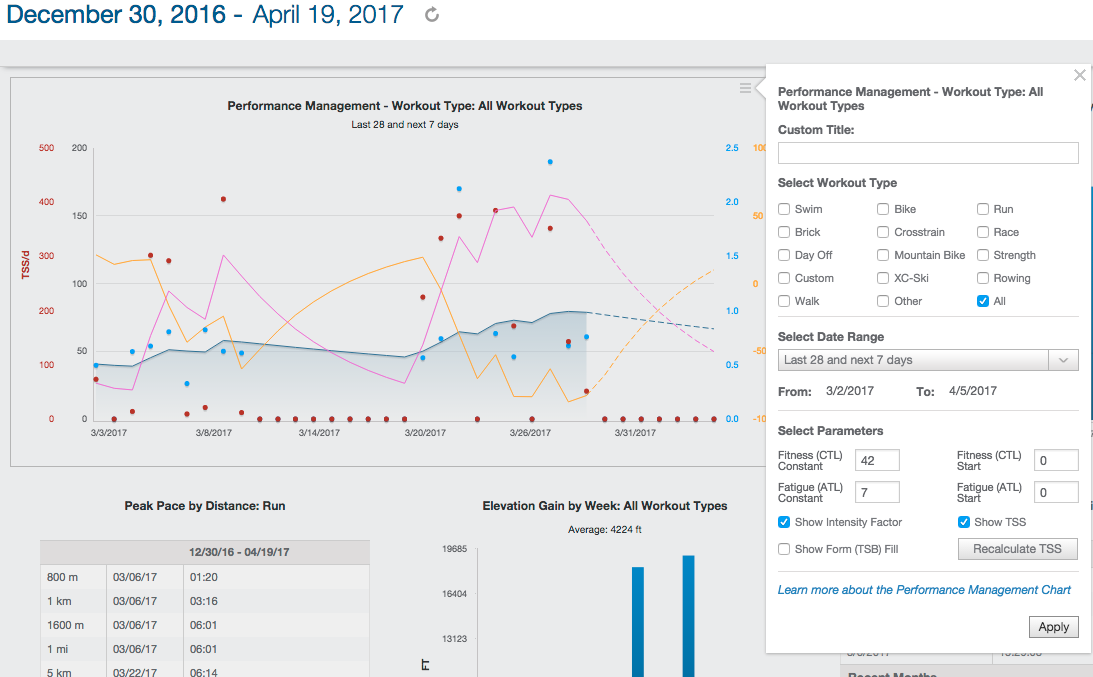
You'll also want to ensure is that your settings are similar to those below:

If your Fitness Constant and Fatigue Constant are the same, it will always show a TSB of 0. For an explanation of why we use 42 and 7, respectively, please see the below article:
What is the Performance Management Chart?