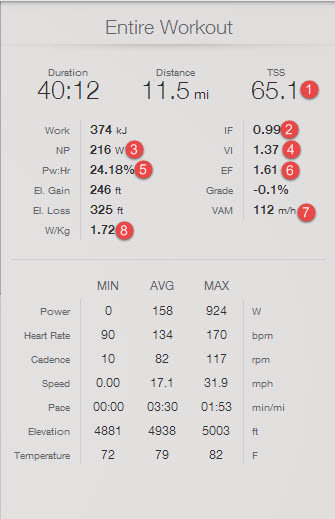
All TrainingPeaks users can view workout summary metrics in the Right Hand Explore in the Expando view of an uploaded file.
What All TrainingPeaks Athletes (Free basic athletes and Premium) Can See
TrainingPeaks displays summary data for any data channels available in the file. What displays depends on what your device recorded. For example, if you record a bike workout and have a power meter, TrainingPeaks will display the summary power data for that workout. If, however, you don't have a power meter, TrainingPeaks will not surface any power data because that data channel isn't in the file.
TrainingPeaks also automatically calculates summary metrics depending on the activity type and data available. For summary metrics to be valid your threshold(s) for the data channel used to calculate those metrics must be both 1) set and 2) correct.
If you're not sure what a threshold is, why it's important, and how to set it in TrainingPeaks please read these articles:
What TrainingPeaks Premium Athlete Can See
TrainingPeaks Premium athletes can not only view summary data and metrics in the Right Hand Explore of the Expando view of a workout, they can:
- Select sections of the workout graph which calculates metrics for that selection. This advanced selection functionality is important for evaluating intervals within a workout.
- Create custom laps within the graph that you can label for easy reference in the future. Laps are really helpful, for example, to see quickly if one is improving when doing high-intensity workouts.
- View advanced analytics of particular sections on the graph like aerobic decoupling, w/kg, VAM, and EF (all of which you can read about below) that provide further insight on your performance.
- Add other charts to your Expando like time in zones charts (power, heart rate, or pace), lap and splits charts to easily evaluate intervals, compare this workout with historical workouts, etc that lends context to the individual workout in comparison to your historical performance.
- View Peak Performances. TrainingPeaks automatically evaluates the workout performance in comparison to your year to date performance and your all-time performance.
- Edit bad data within your file. Recording devices still make mistakes that you can quickly and easily remove.
 |
